
The Enza Bi team brings together top experts in data analysis and visualization. It offers advanced analytics, profit tracking, and key performance indicators for agribusiness companies.
I joined the Enza Bi team focusing on creating a quality data-driven interface using Power Bi data. My main goal was a usability focused redesign campaign for the whole tool. With the team, we redesigned the web application, created a design system that will allow scaling the service, and provided new data visualization opportunities.
I joined the Enza Bi team focusing on creating a quality data-driven interface using Power Bi data. My main goal was a usability focused redesign campaign for the whole tool. With the team, we redesigned the web application, created a design system that will allow scaling the service, and provided new data visualization opportunities.

The main point of entry and switching between work areas is the navigation and multi-level menus. The updated design focuses on simplicity and intuitiveness, providing a more convenient way to navigate through the application.

The main blocks of the web application, including a KPI block, an interactive line chart and tabs for switching between different parts of the report. The updated design focuses on clarity and functionality, providing users with easy access to key information and analysis tools.


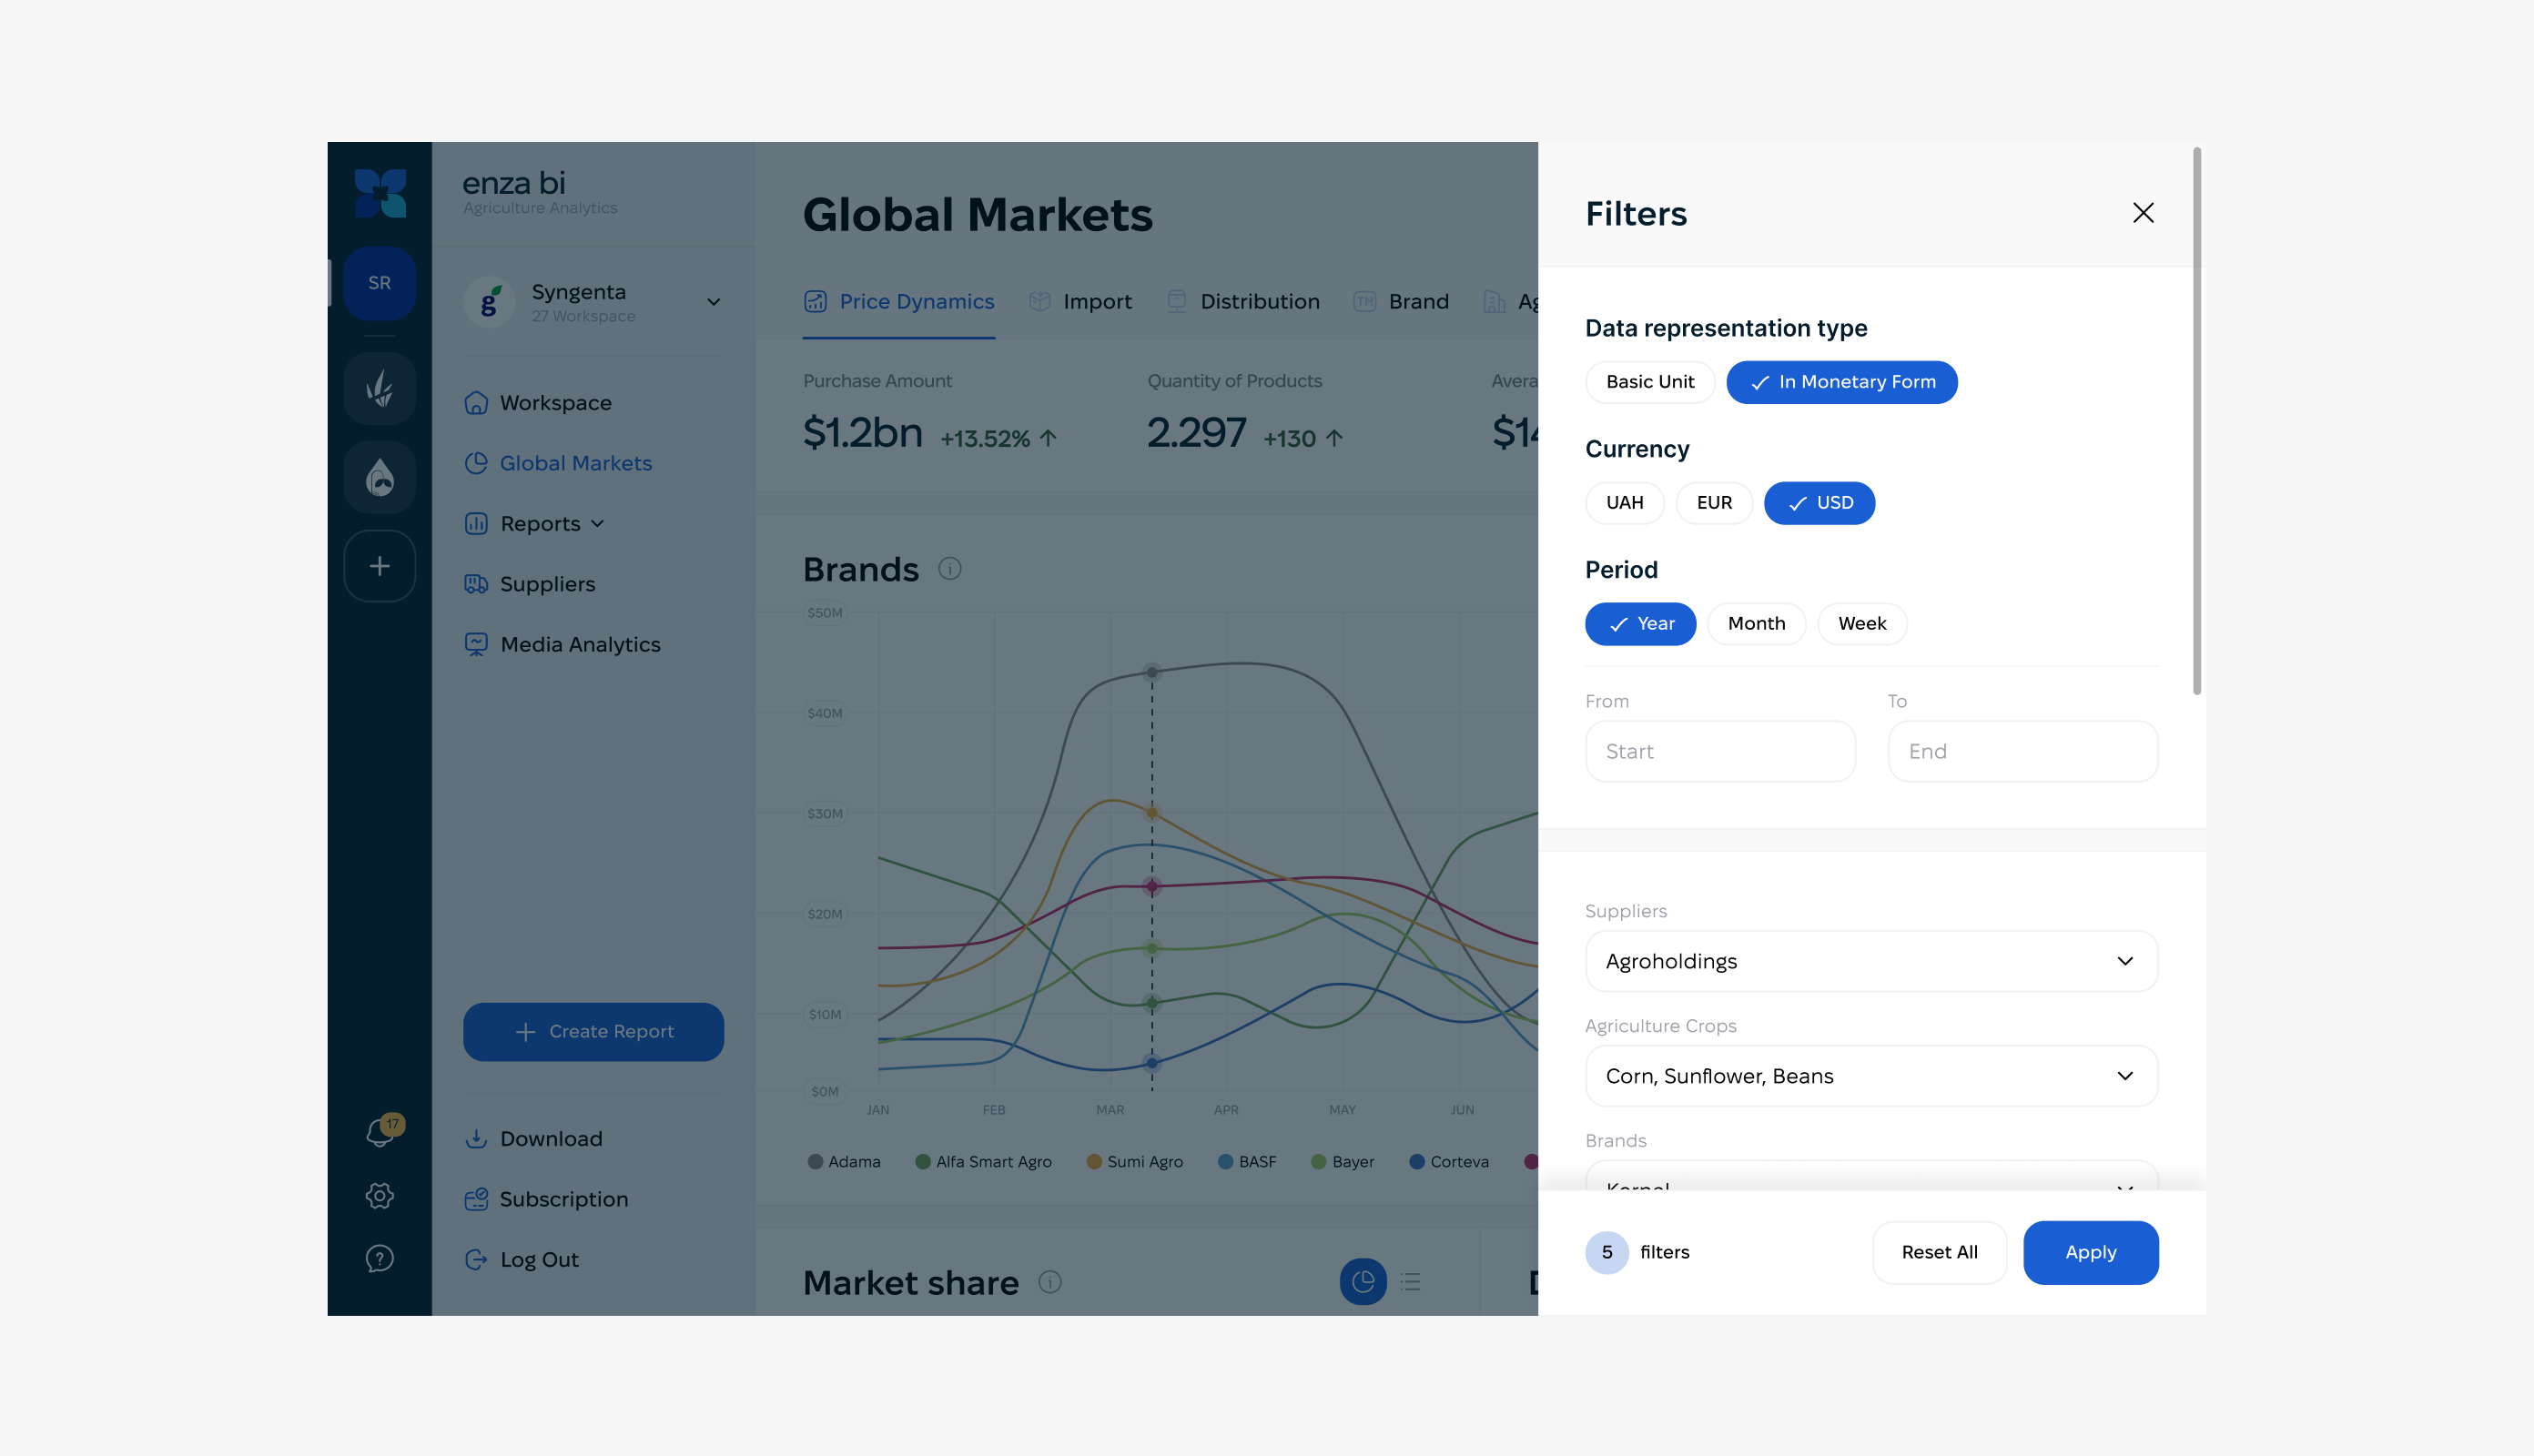
The filter system allows users to easily customise the data output for analysis. The new design provides a more intuitive and efficient way to manage data, enhancing the usability of the application.
The interactivity of all visualisations allows the user to get basic information about the data by hovering over the relevant elements. This update makes reports more informative and makes the process of analysing data more convenient and efficient.


The main focus is on the clarity and accessibility of the data in the tables. The new design gives tables a more organised look, making information clearer and more easily accessible to users.


